Mapping Competitor Ad Creative and Landing Page Variants
Mapping competitor ad creative and landing page variants is a data pipeline problem wearing a marketing costume. The job is to pull structured records out of ad libraries, landing pages, and creative assets, keep them fresh, and make them comparable across sources that were never built to talk to each other.
Most marketers still treat this as a once-a-month fire drill: someone opens the Meta Ad Library, screenshots a few ads, drops them in a slide deck, calls it competitive intelligence. Over 65% of B2B marketers now use some form of competitive advertising intelligence, so the practice itself is standard. The plumbing that generates it is what varies wildly. A manual competitive scan eats up 8 to 12 hours a week. Automate that same workflow properly, and it drops to about 30 minutes with 90% better accuracy, mostly because a machine doesn't get bored on page four of a Google Ads Transparency Center scroll.
The real cost of doing this by hand is not measured in hours. It's that a manual pull only ever shows a snapshot of what's live today. It can't tell which creative angle is accelerating, which landing page variant just got killed after a bad test, or what changed since last Tuesday. That's the whole game, and a spreadsheet updated once a month can't play it.
What the data sources expose, and what they withhold
Six sources are worth wiring into any serious pipeline, and each one lies to you in a slightly different way.
Meta Ad Library shows every active ad: creative, run dates, the advertiser's page. Political and social-issue ads come with a spend range for EU-targeted ads, and Meta banned that ad category in the EU entirely starting October 2025. Commercial ad spend was never published and still isn't. So the real signal here isn't spend at all, it's creative count and how long a given ad stays live.
Google Ads Transparency Center covers search, display, and video creative by advertiser, with last-shown dates visible. Spend appears only for political ads. Everywhere else, creative volume is the proxy.
LinkedIn Ad Library covers B2B ads by company going back 12 months, but run dates and targeting only show up for EU-targeted ads. It's the strongest source for sales-led and account-based competitors, mostly because that's who actually advertises on LinkedIn.
TikTok Creative Center surfaces top-performing ads by industry, region, and date, with rough impression buckets that hint at which angles are scaling. It's built for hook and format research, not spend tracking.
SimilarWeb and SEMrush give traffic estimates, paid keyword bids, and ad copy samples. These are panel-based tools, so the numbers are directional, not literal. Cross-check anything from here against an official ad library before making a decision off it.
Adbeat and Pathmatics supply display spend estimates, placements, and ad-server data. Costs more, but earns its keep once a team is tracking ten or more advertisers at once.
Spend numbers from panel tools are estimates, full stop. The only spend figure that's a hard fact anywhere in this stack is the political and social-issue ad spend range, and that's a narrow slice of the ad universe. For everything else, creative volume and run duration have to stand in for dollars.
And landing page URLs, which show up inside these ad creative records, aren't always clickable or stable. They need to get captured the moment they're pulled, because assuming a URL will still resolve next week is how a pipeline quietly loses its most useful data point.
Designing the normalized schema that makes multi-source data comparable
Six sources, six different data shapes. A normalizer isn't a nice-to-have here, it's the thing that makes the whole project function rather than becoming six separate spreadsheets that never talk to each other.
The canonical record needs: advertiser, platform, creative_id, first_seen, last_seen, est_spend_range, creative_text, cta, and landing_url. That's the shared spine every source maps onto.
Anything platform-specific, one platform's region-only targeting tags, another platform's spend ranges, a third platform's format metadata, goes into a sidecar JSON column. That way the odd, platform-flavored details don't get lost, but they also don't force every other source to grow fields it doesn't need.
first_seen and last_seen determine how long a creative has been live, which is what separates a six-week run from a three-day one. Run duration is the closest thing to a spend proxy that exists outside political ads; a creative that's been live for six weeks signals something very different than one that ran for three days and vanished, run duration is the clearest behavioral signal available when spend figures aren't published.
The creative_id has to stay stable across every pull, or the whole dataset fills up with duplicate ghosts of the same ad. When a platform doesn't hand over a native ID (and most don't, reliably), generate a deterministic hash from a stable combination of record fields. Same inputs, same hash, every time.
Scraping landing page variants at scale: the technical workflow
Landing pages don't play by ad library rules. There's no public API for them. Variants get served dynamically, they depend on cookies and session state, and they're often sliced by geography or device. Nobody's handing over a clean feed here.
The baseline insight, the one every performance marketer already half-knows, is that A/B tests usually run on cookies. A fresh, cookie-less browser session can land on a completely different variant than a returning one. That single fact is the entire basis for automating variant detection.
A working setup looks something like this: visit the page 12 times a day, rotating user agents and IPs each time, alternating between cleared-cookie sessions and persistent ones so both variant buckets actually surface. Capture a full DOM snapshot plus a full-page screenshot on every visit. Then narrow extraction down to the hero section, the primary CTA, and the surrounding micro-copy, not the whole page. Grabbing everything sounds thorough; it just turns into storage bloat and processing bills nobody asked for.
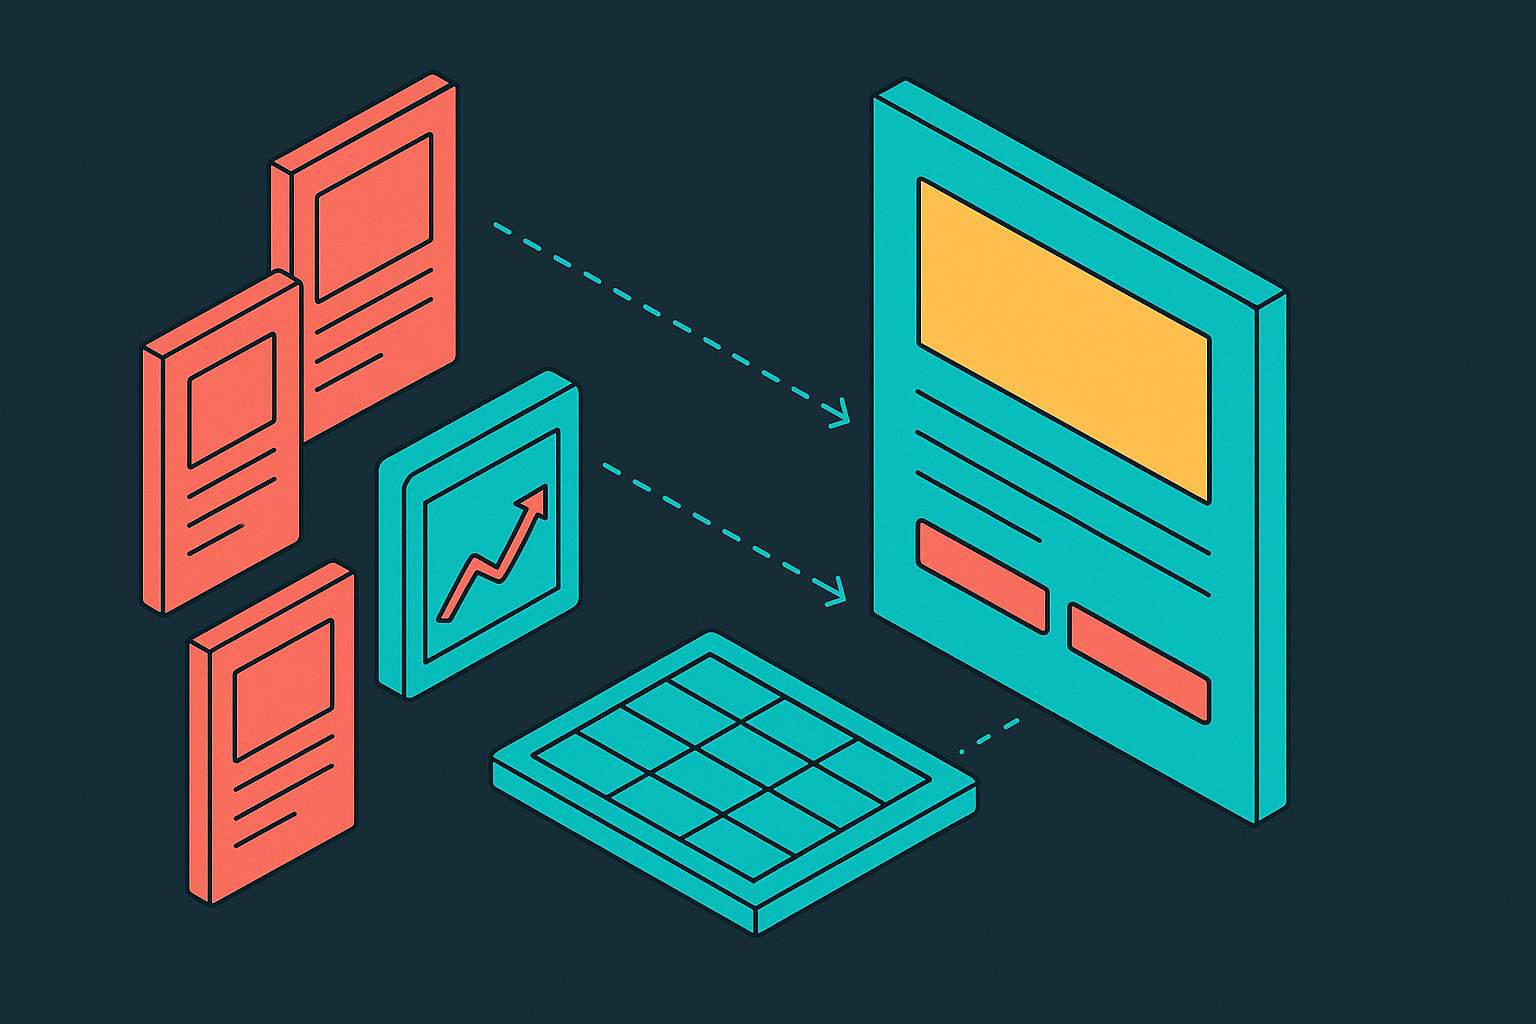
From there, group the hero variants by message theme, "Security" versus "Speed" versus "Cost savings", and correlate against experiment IDs when they show up in data attributes or network calls. That clustering step is what turns a pile of screenshots into an actual read on what a competitor is testing.
Beyond the A/B angle, the same scrape should be tracking product names and descriptions, pricing display, where social proof sits on the page, CTA text and placement, stock availability signals, new product launches, and pages that quietly vanish between scrapes. A discontinued listing is a data point. Treat it like one.
The anti-bot environment your pipeline will run into in 2026
Cloudflare started blocking declared AI crawlers by default back in July 2025, and the net widened further on September 15, 2026, when mixed-use crawlers became blocked by default for domains onboarded after that date. That's not a minor policy footnote, it changes what "just scrape the page" means in practice.
Getting past Cloudflare now means matching every detection layer at once, not just spoofing a user agent and hoping for the best: TLS and HTTP/2 fingerprints, browser fingerprints, JavaScript execution, proxy reputation, Turnstile challenges, session behavior. Missing one gets the whole request flagged regardless of how convincing the rest of it looks.
JA4 fingerprinting is the one to understand specifically. It replaced JA3 after Chrome started randomizing TLS extension order back in 2023, and by 2026, Cloudflare, Akamai, and AWS WAF all lean on JA4 as a primary detection signal. A scraper that doesn't spoof its TLS handshake correctly gets identified before the first HTTP request even finishes. Not after the page loads wrong. A scraper that doesn't spoof its TLS handshake correctly gets identified before it loads.
DataDome, meanwhile, runs more than 85,000 customer-specific machine learning models. Every protected site is effectively its own unique puzzle, trained on its own traffic. Whatever worked on one competitor's site tells you approximately nothing about whether it'll work on the next one.
The silent failure mode that invalidates competitive data without triggering an error
Scraped data goes stale quietly, and that's the failure that actually costs money. No error, no red flag, nothing crashes. The scraper runs, returns a value, logs success, and the number just stops updating, because the underlying page changed in a way the extraction logic never noticed.
A team acting on a competitor feed that's a week or two out of date is making a delayed decision while believing, with total confidence, that it's current. It's making a delayed decision while believing, with total confidence, that it's current. Those are not the same thing, even though they feel identical from inside the dashboard.
"The scraper ran" and "the data is correct" are two separate questions, and a pipeline that treats them as one is a pipeline waiting to embarrass someone in a Monday meeting.
A few checks close most of that gap. Flag any record where last_seen hasn't updated in some fixed window, despite the fetcher reporting success, because a suspiciously quiet field is a symptom, not a coincidence. Diff the DOM structure between captures, not just the visible text, since layout changes appear before the copy does and often signal a bigger variant shift underneath. Treat a landing page that 404s or redirects as a signal to log, not an error to swallow, because that's frequently a product launch or a pricing overhaul in disguise. And run a cross-source sanity check: if a competitor's ad points to a landing URL the scraper says hasn't changed in 30 days, while that same ad has cycled through new creative variants in the meantime, something in the extraction is broken. The ad account doesn't lie as often as the scraper does.
Using AI to cluster creative angles and produce a weekly competitive brief
The weekly diff, not the full library, is the actual unit of intelligence here. What's new, what disappeared, what's scaling. The entire historical archive is too much to reason about in one sitting, and nobody's asking for that anyway.
A workable process: run Claude or GPT against that week's delta in JSON form, and prompt it specifically to cluster by message angle, flag brand-new creatives, and estimate budget direction from the change in creative volume, while explicitly telling it not to invent spend figures it doesn't have. Models will happily fabricate a dollar amount if asked nicely, so the instruction not to has to be explicit.
The output should follow a fixed schema: advertiser, new_angles_spotted, angles_paused, suspected_budget_direction, one sentence of evidence citing actual creative counts and dates, and a watch_next_week field. Pushing that straight into Slack and Notion, formatted so it doesn't need a second AI pass just to be readable, gets it in front of the team immediately.
A human still needs to sign off before any of this reaches internal channels. AI-generated briefs are useful. They are not authoritative, and skipping that review step is how a hallucinated budget estimate ends up quoted in an executive update as fact.
Alert thresholds matter just as much as the summary itself. One new creative appearing isn't a budget shift, it's Tuesday. Set real thresholds on creative volume change and run duration before anything fires an alert, or the whole team starts ignoring the channel by week three.
The ad intelligence and creative intelligence tool landscape for 2026
The tool category has split into two camps that rarely overlap. Ad spy tools look outward, building competitor creative databases. Creative intelligence platforms look inward, breaking down element-level performance on a brand's own ads. Most vendors commit hard to one side or the other.
On the ad spy and competitive monitoring side: Sensor Tower's Pathmatics covers broad multi-channel display and video spend estimation. Similarweb's Digital Marketing Intelligence handles traffic estimates and paid keyword data, panel-based and directional like the rest of that category. Semrush AdClarity uses AI-powered ad intelligence across display, video, social, and connected TV, monitoring campaigns across multiple markets through a large human panel. Adbeat focuses on display intel: spend estimates, placements, ad-server data. AdSpy specializes in Facebook and Instagram, with granular search by ad copy text, advertiser name, or landing page URL. AdStellar takes a different approach entirely, cloning competitor ads straight out of the Meta Ad Library and using AI to generate image, video, or UGC-style variants from them.
On the creative intelligence side, pricing (checked against vendor pages in 2026) breaks down like this: Segwise starts at $499 a month with a 7-day free trial. Motion runs $750 a month. Singular's Creative IQ prices at $0.05 per unit. AppsFlyer's Creative Optimization offers a free Zero plan before stepping up to $0.07. Superads costs $125 a month. VidMob doesn't publish pricing at all as of July 2026, it's enterprise, contact-sales only.
Picking between the two camps comes down to the question actually being asked. Trying to figure out what a competitor is running calls for the ad spy tools. Trying to figure out why a brand's own creative is or isn't converting calls for the creative intelligence platforms. Most serious competitive intelligence setups end up needing a foot in both camps, because knowing what the competition is doing and knowing why your own ads perform are, annoyingly, two entirely different questions.